Building Reports with BigQuery + Looker Studio
- 01 Nov 2024
- 3 Minutes to read
- Contributors


- Print
- DarkLight
Building Reports with BigQuery + Looker Studio
- Updated on 01 Nov 2024
- 3 Minutes to read
- Contributors
- Print
- DarkLight
Article summary
Did you find this summary helpful?
Thank you for your feedback
LimaCharlie does not include reporting by default, however our granular and customizable Output options allow you to push data to any source and use third-party tools for reporting. In this tutorial, we'll push a subset of LimaCharlie EDR telemetry to BigQuery and analyze our data using Google's Looker Studio. We'll be doing the work in the web UI, however this could also be done via the API.
For this example, we will aggregate and analyze Windows processes making network connections.
Preparing BigQuery
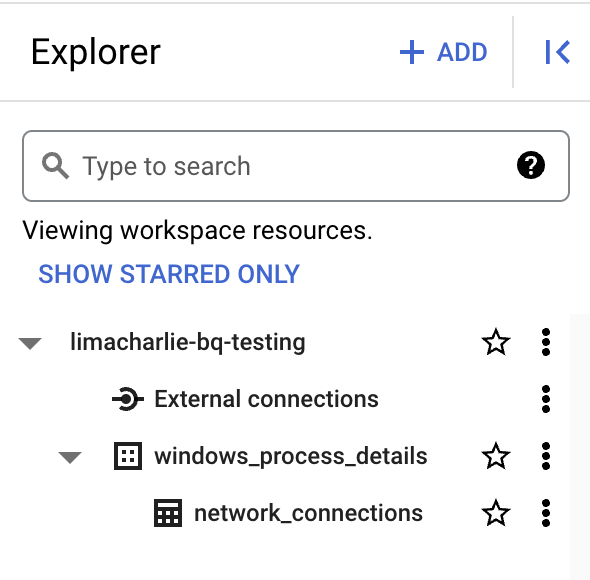
Within your project of choice, begin by creating a new dataset. For the purposes of this tutorial, I'm going to create a dataset named windows_process_details. Within this dataset, I'll create a table named network_connections.
Let's examine this hierarchy for a moment:
├── limacharlie-bq-testing    # project
│   ├── windows_process_details    # dataset
│   │   ├── network_connections    # table
The nice part about this type of hierarchy is that I can build out multiple tables of process details within the same dataset, and then link/analyze them as needed. We'll focus on the network_connections data for now, but we could also look at exporting other process details into the same dataset.
Within the Google Cloud Console, we also want to create a Service Account and gather an API key. More details on that can be found here.
Copy the API key and keep it somewhere safe, we'll need to configure it in the output.
Creating the BigQuery Output
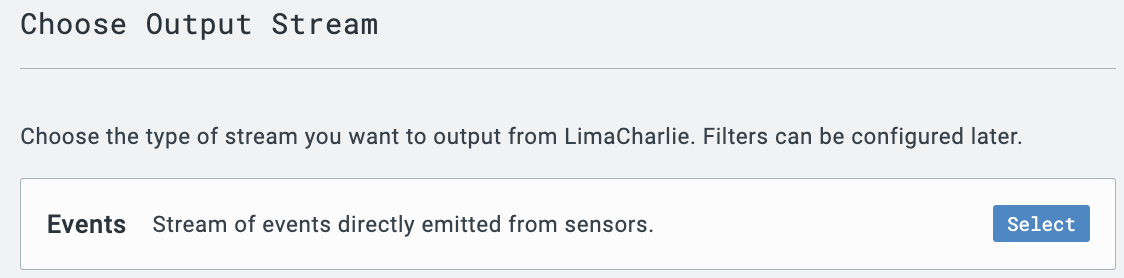
Creating an Output within LimaCharlie is straightforward. Navigate to Outputs in the web UI, select + Add Output, and select Events. Note, we want to export raw events in this case - however, we'll use filters to export only the events of interest to BigQuery.
Within the Output Destination menu, select Google Cloud BigQuery. You'll be prompted with a configuration menu; expand the Advanced Options, as we'll need those too.
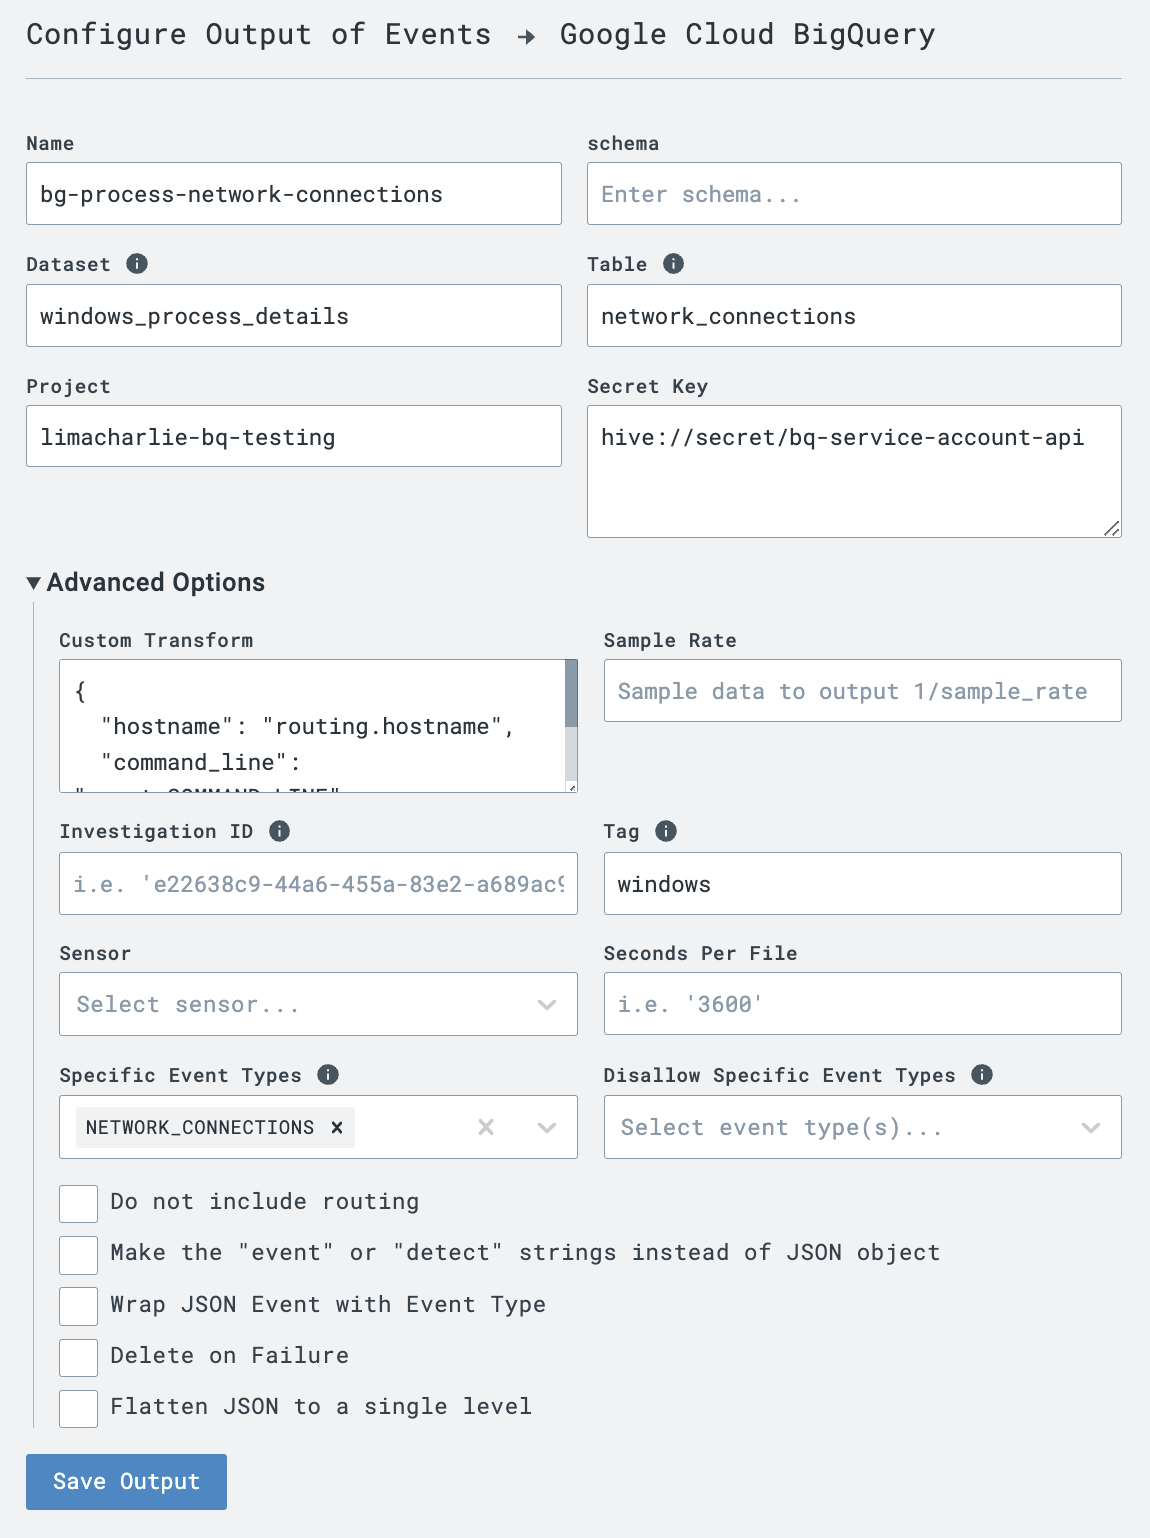
The following values must be provided in order for the Output to work:
- Name (choose your own name)
- Dataset (from the previous section)
- Table (from the previous section)
- Project (from the previous section)
- Secret Key (the API key from the GCP service account)
Where to Store the Secret?
The secret key for this output can be inserted directly in the web app helper, however we recommend keeping secrets in the Secret hive for centralized management.
Within the Advanced Options, we'll need to provide the following details:
- Custom Transform - we don't want to include all the details from the
NETWORK_CONNECTIONSevent. For this output, we are interested in processes making network connections and the users associated with them. Thus, we'll apply the following transform to pare this down:
{
  "hostname": "routing.hostname",
  "command_line": "event.COMMAND_LINE",
  "user": "event.USER_NAME"
}
Within the Specific Event Types field, we'll specify only NETWORK_CONNECTIONS. This is another way to pare down the number of events processed and exported.
Finally, we'll also specify a tag of windows, ensuring we only capture Windows systems (per our tagging - your tags may differ). Based on the values provided and discussed, here's a screenshot of the Output configuration (minus the API key):
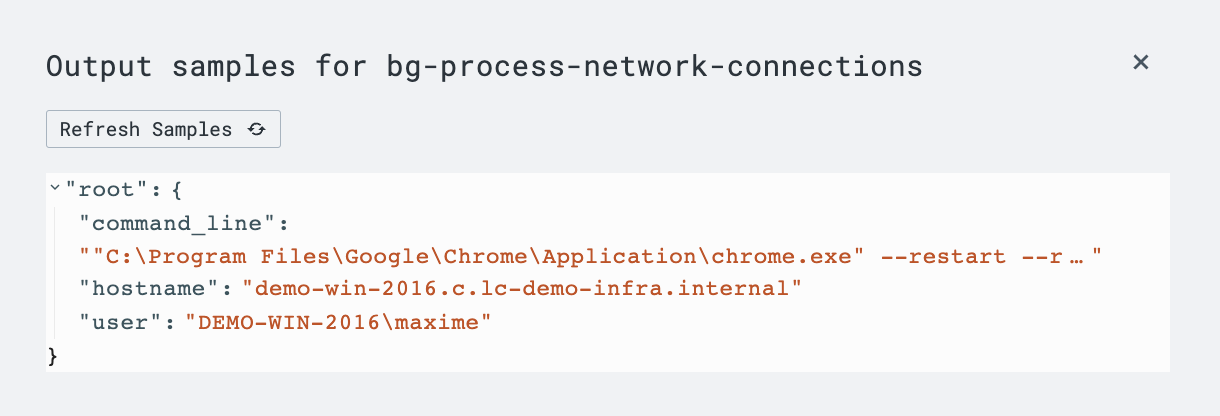
Save the output details, and then check View Samples in the Outputs menu to see if you're successfully seeing events.
Analyzing Events in BigQuery + Looker Studio
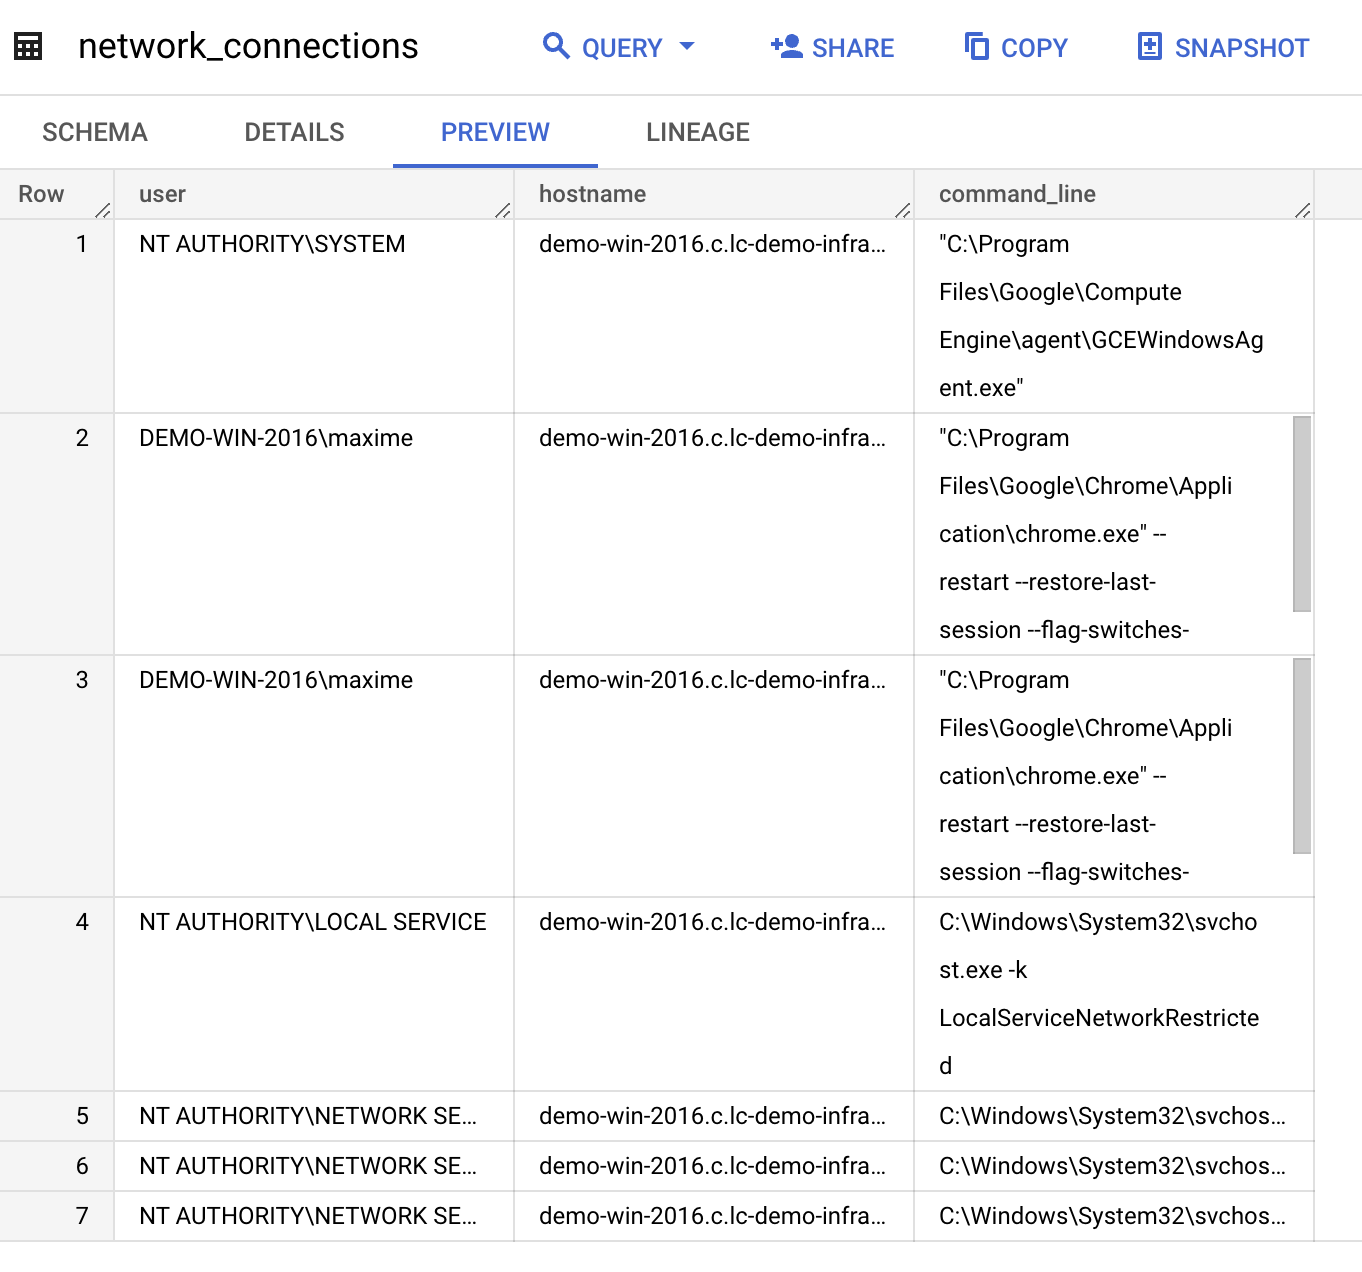
Navigating back to BigQuery, we can see some initial events flowing in:
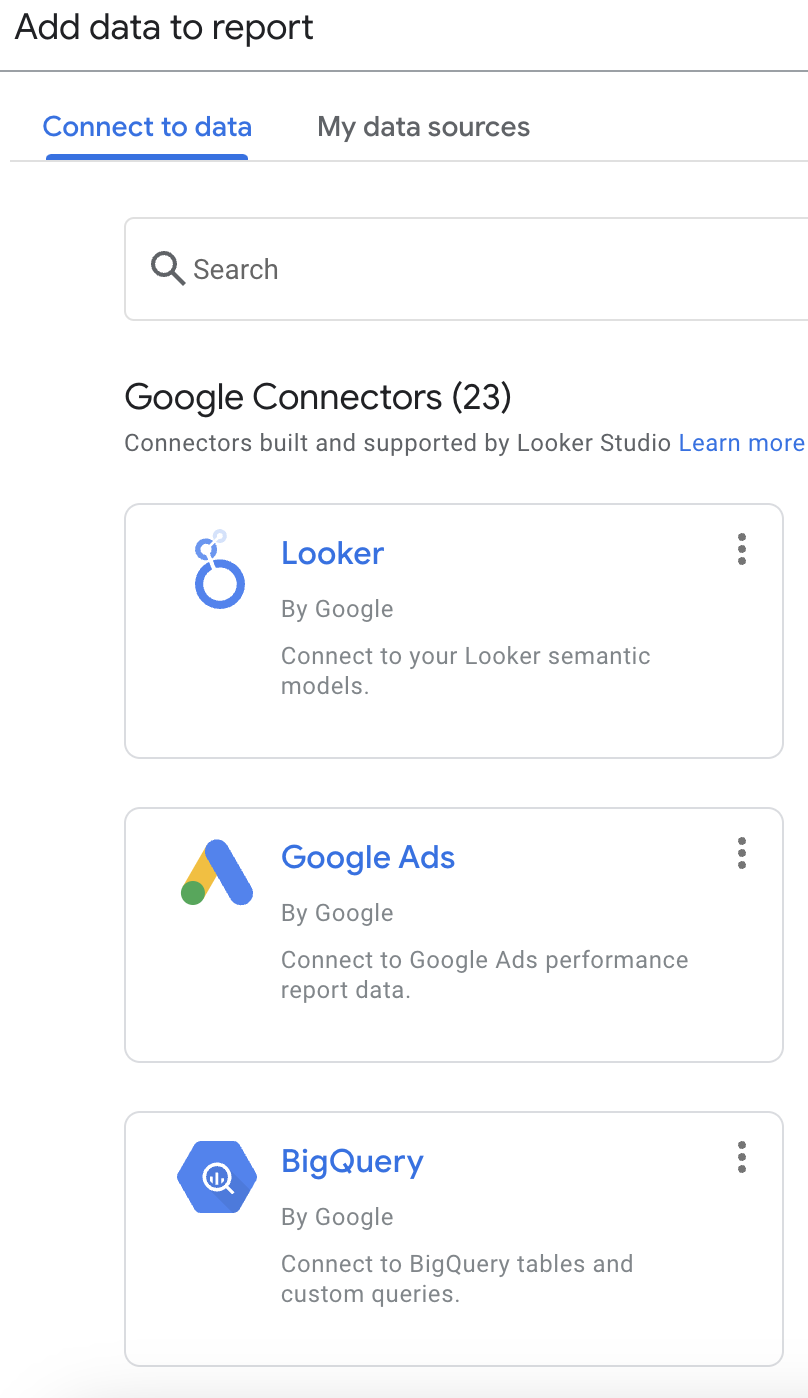
Let's hop over to Looker Studio. Create a Blank Report, and select BigQuery in the Connect to Data menu.
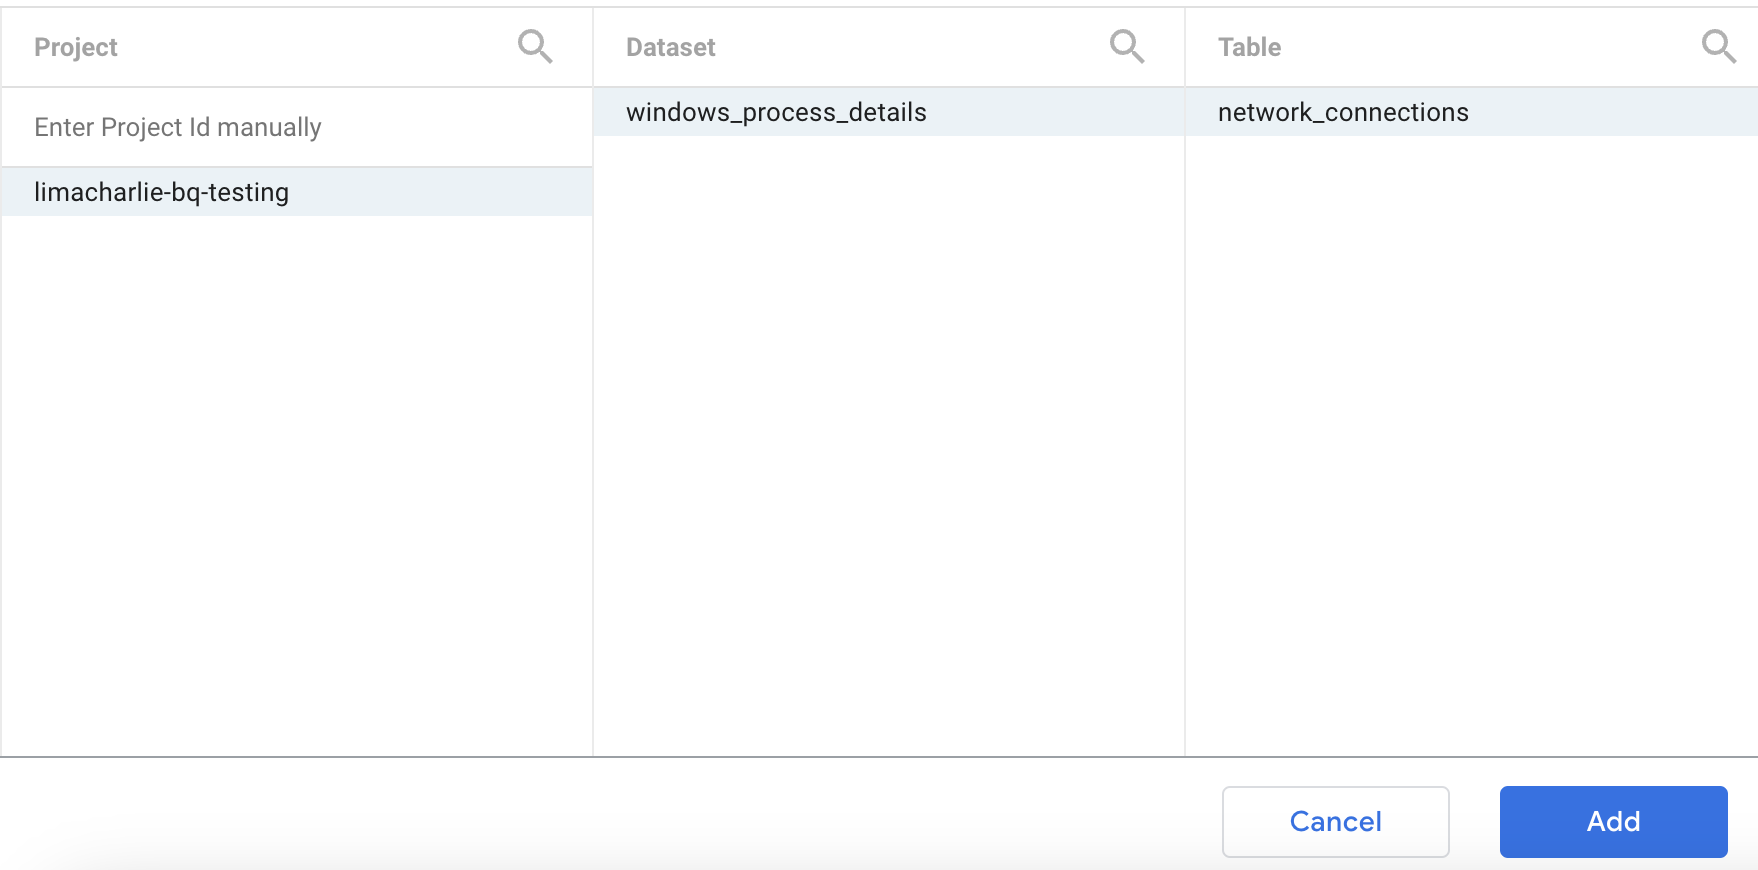
Select the Project, Dataset, and Table of interest, and click Add.
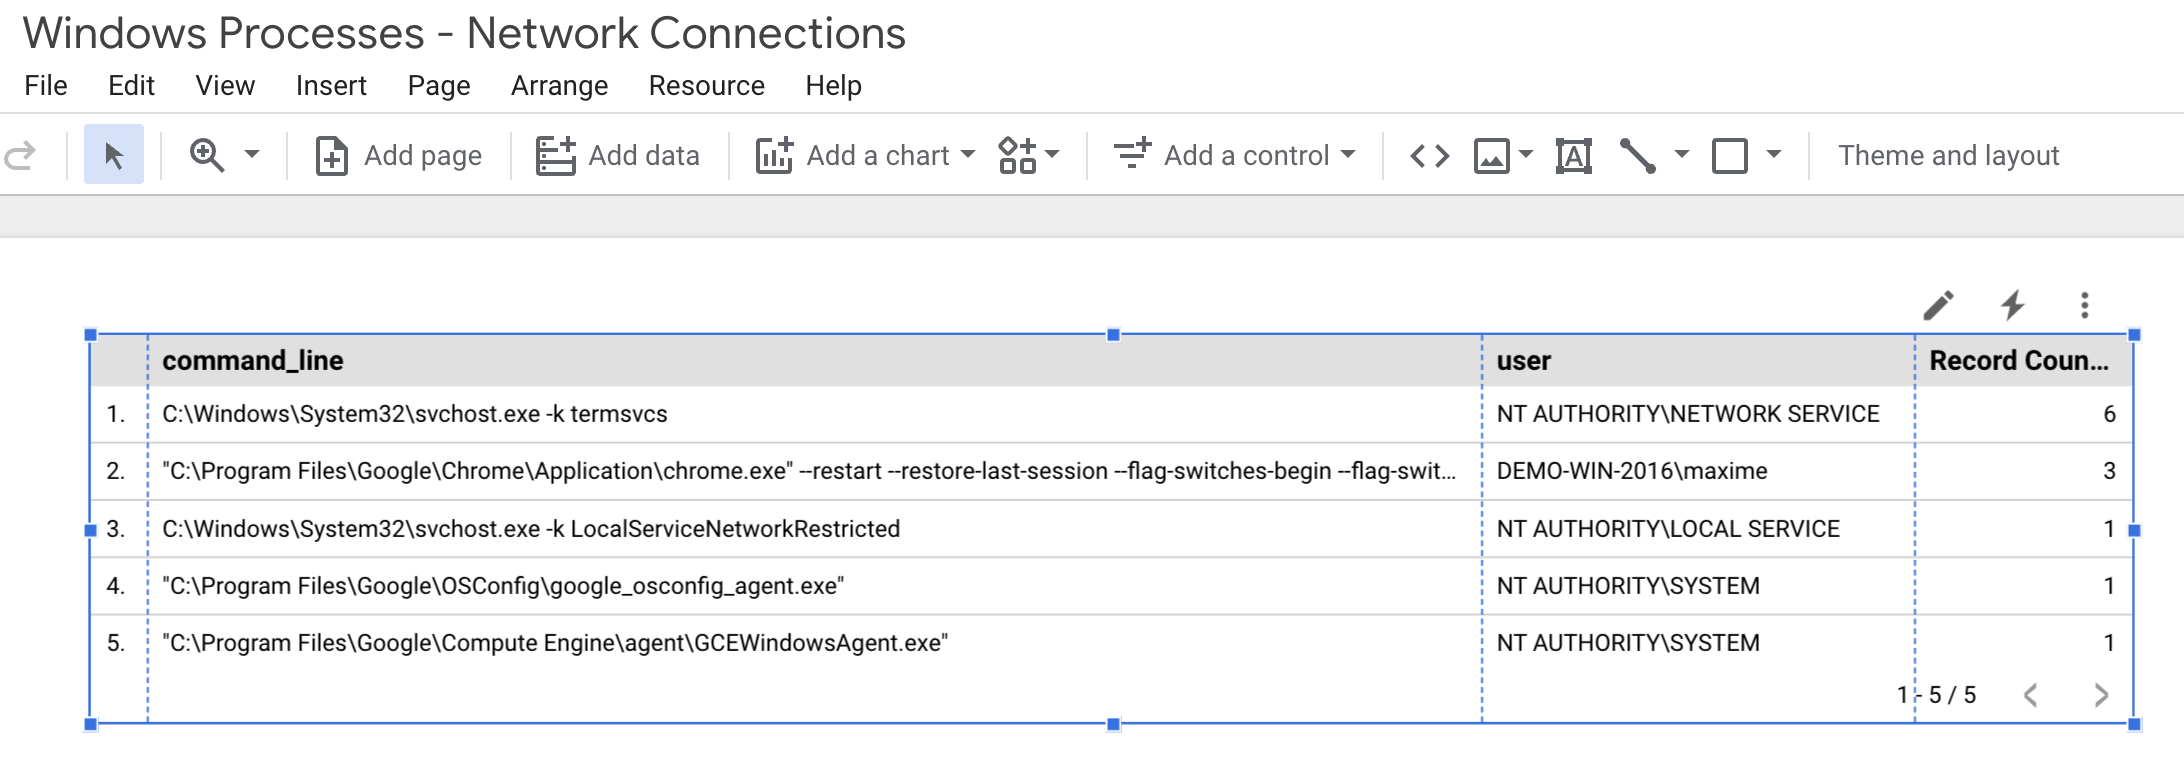
Looker Studio may prompt you about permissions of connected data. However, once connected, we'll be able to see a starter table with aggregate details from our network_connections table.
And that's it! From here, you can manipulate and move around the data as needed. You can also blend with another table, allowing you to combine multiple data points.
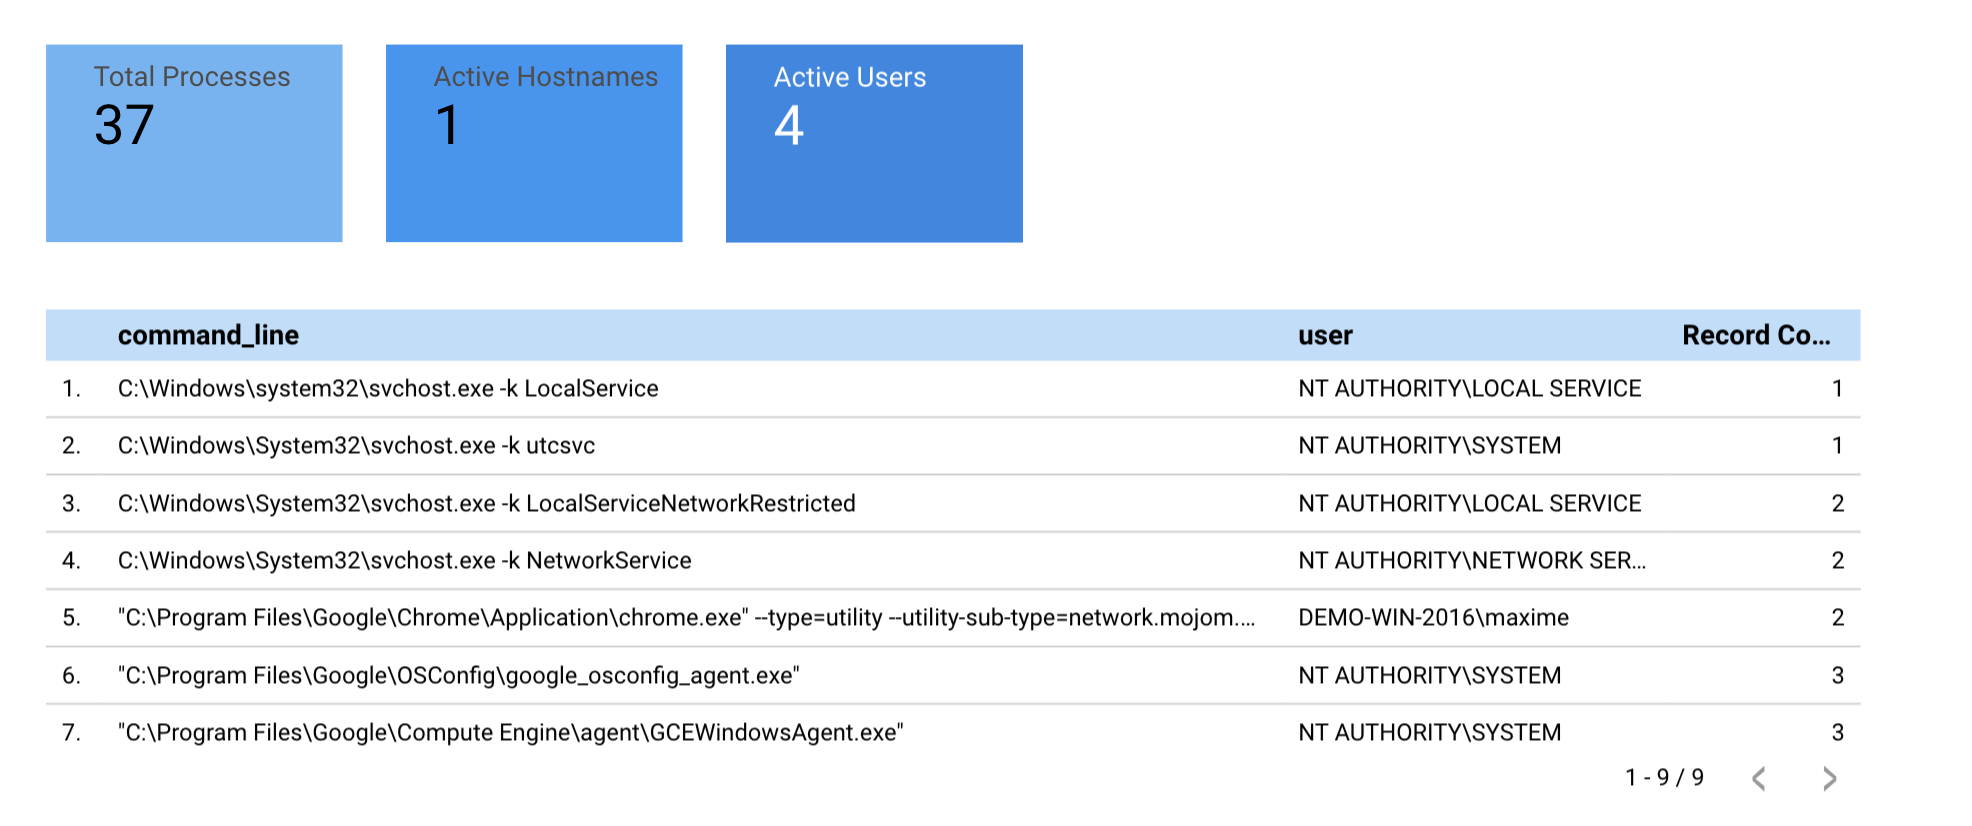
Reports can also be styled, additional statistics generated, etc. The following example continues to pull on the basic data we exported to provide some unique insights:
Was this article helpful?