Building Blocks & Recipes
This page shows what you can put inside an app and gives copy-and-paste recipes for the most common requests: tables, dashboards, charts, interactive controls, and embedded panels.
You don't have to type any of this
The recipes below show the shape of a finished app so you can see what's possible and tweak the result. The easiest way to get one is still to ask the AI assistant for the outcome — "a doughnut chart of online vs offline sensors" — and let it write the code. Each recipe includes a prompt you can start from.
The building blocks
Every app is a small web page. You don't style it from scratch — LimaCharlie injects a design system so your app automatically matches the console, including light and dark mode. You build with a handful of ready-made pieces:
| Piece | What it is | Class |
|---|---|---|
| Card | A bordered container for a section | .lc-card |
| KPI | A big number with a label, for dashboards | .lc-kpi |
| Table | A clean, console-styled table | .lc-table |
| Badge | A status pill (positive / warning / danger) | .lc-badge |
| Button | A primary, neutral, or danger button | .lc-btn |
| Inputs | Text fields, selects, text areas | .lc-input, .lc-select |
| Chart | A bar / line / doughnut chart | lc.chart(...) |
| Layout | Rows, columns, and vertical stacks | .lc-row, .lc-col, .lc-stack |
The full list of pieces and the color tokens behind them is in the Reference. The golden rule: never hardcode colors or fonts — use the building blocks, and your app stays on-brand and dark-mode ready for free.
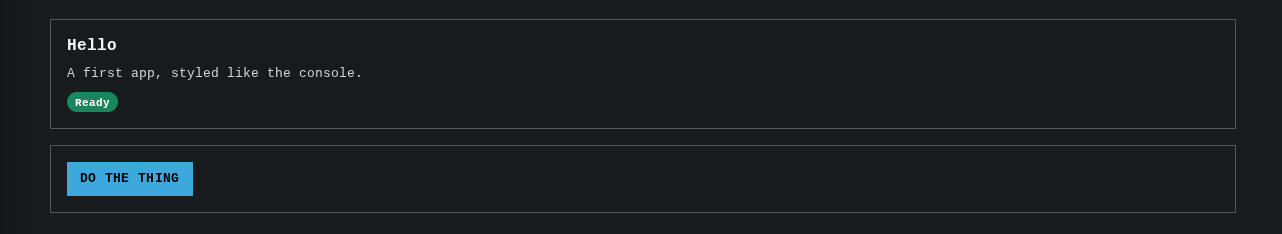
Here's a tiny app that uses several pieces together:
<div class="lc-stack">
  <div class="lc-card">
    <h2>Hello</h2>
    <p class="lc-muted">A first app, styled like the console.</p>
    <span class="lc-badge lc-badge--positive">Ready</span>
  </div>
  <div class="lc-card">
    <button class="lc-btn lc-btn--primary">Do the thing</button>
  </div>
</div>
Getting your data
Apps read live LimaCharlie data through a built-in helper called lc.api. You
never paste an API key — the console attaches a temporary, permission-scoped key
for you (see How apps stay safe).
The pattern is always the same: wait until the runtime is ready, then call the API.
<div class="lc-card" id="out">Loading…</div>
<script>
  ;(async () => {
    await lc.ready                                 // wait for the secure handshake
    const oid = lc.ctx.orgs[0].oid                 // the current organization
    try {
      const who = await lc.api('GET', '/v1/who')   // a LimaCharlie API call
      document.getElementById('out').textContent = 'Signed in as ' + who.ident
    } catch (e) {
      document.getElementById('out').textContent = 'Error: ' + e.code
    }
  })()
</script>
There are three kinds of data an app can reach:
- The main LimaCharlie API — sensors, detections, org info, and more, via
lc.api('GET', '/v1/...'). This is the default. - First-party services — historical event Search, Cases, Replay,
and AI — by adding
{ service: '...' }to the call. See Recipe: query historical events. - External websites — only if the app explicitly declares them (and you approve them on the consent screen). See Recipe: call an external service.
Each call needs a matching permission, which appears on the consent screen. For
the exact lc.api rules, services, and limits, see the
Reference.
Recipe: a KPI dashboard
A row of big numbers is the quickest win for an at-a-glance view.
Ask the assistant:
"A dashboard with two big numbers: total sensors and sensors online right now."
<div class="lc-row">
  <div class="lc-card"><div class="lc-kpi">
    <span class="lc-kpi__value" id="total"><span class="lc-spinner"></span></span>
    <span class="lc-kpi__label">Total sensors</span>
  </div></div>
  <div class="lc-card"><div class="lc-kpi">
    <span class="lc-kpi__value" id="online"><span class="lc-spinner"></span></span>
    <span class="lc-kpi__label">Online now</span>
  </div></div>
</div>

<script>
  ;(async () => {
    try {
      await lc.ready
      const oid = lc.ctx.orgs[0].oid
      const res = await lc.api('GET', '/v1/sensors/' + oid)
      const sensors = res.sensors || []
      document.getElementById('total').textContent = sensors.length
      document.getElementById('online').textContent =
        sensors.filter((s) => s.is_online).length
    } catch (e) {
      document.getElementById('online').innerHTML =
        '<span class="lc-badge lc-badge--danger">' + e.code + '</span>'
    }
  })()
</script>
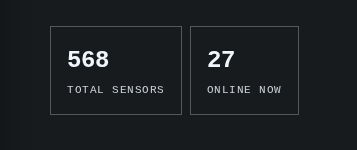
Permissions: sensor.list (read-only).
Each value starts as a .lc-spinner, swapped for the number once the data
arrives. Do this — and wrap calls in try/catch — in every data-backed app so
it shows progress and surfaces errors instead of sitting on a blank dash.
Recipe: a data table
Tables are the workhorse of security tooling. Use .lc-table and fill the rows
from an API call.
Ask the assistant:
"A table of my sensors showing the hostname and whether each one is online, with a Refresh button."
<div class="lc-card lc-stack">
  <div class="lc-row" style="justify-content:space-between">
    <h2>Sensors</h2>
    <button class="lc-btn lc-btn--primary" id="refresh">Refresh</button>
  </div>
  <table class="lc-table">
    <thead><tr><th>Hostname</th><th>Status</th></tr></thead>
    <tbody id="rows"><tr><td colspan="2" class="lc-muted">Loading…</td></tr></tbody>
  </table>
</div>

<script>
  const rows = document.getElementById('rows')

  async function load() {
    rows.innerHTML = '<tr><td colspan="2" class="lc-muted">Loading…</td></tr>'
    try {
      await lc.ready
      const oid = lc.ctx.orgs[0].oid
      const res = await lc.api('GET', '/v1/sensors/' + oid)
      const sensors = res.sensors || []
      rows.innerHTML = sensors
        .map((s) => {
          const badge = s.is_online
            ? '<span class="lc-badge lc-badge--positive">online</span>'
            : '<span class="lc-badge">offline</span>'
          return '<tr><td>' + (s.hostname || s.sid) + '</td><td>' + badge + '</td></tr>'
        })
        .join('')
    } catch (e) {
      rows.innerHTML = '<tr><td colspan="2">Error: ' + e.code + '</td></tr>'
    }
  }

  document.getElementById('refresh').addEventListener('click', load)
  load()
</script>
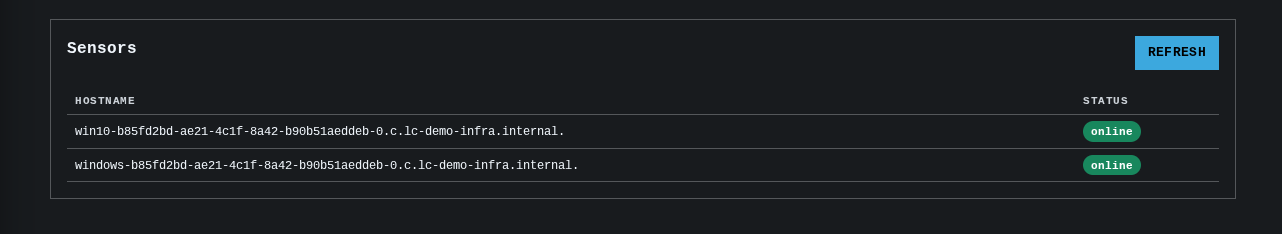
Permissions: sensor.list. Want more columns (platform, last seen, external
IP)? Just ask the assistant — it confirms the exact field names against your live
data.
Recipe: a chart or graph
Charts use lc.chart(target, spec) — a themed wrapper over Chart.js, the same
engine the LimaCharlie console charts with. You point it at an element, hand it a
{ type, data, options } spec, and it draws a chart that already matches your
theme and re-colors itself when you toggle dark mode.
Ask the assistant:
"A doughnut chart of online vs offline sensors."
<div class="lc-card" style="height:280px"><canvas id="chart"></canvas></div>

<script>
  ;(async () => {
    await lc.ready
    const oid = lc.ctx.orgs[0].oid
    const res = await lc.api('GET', '/v1/sensors/' + oid)
    const sensors = res.sensors || []
    const online = sensors.filter((s) => s.is_online).length
    const offline = sensors.length - online

    lc.chart('chart', {
      type: 'doughnut',
      data: {
        labels: ['Online', 'Offline'],
        datasets: [{ data: [online, offline] }],
      },
    })
  })()
</script>
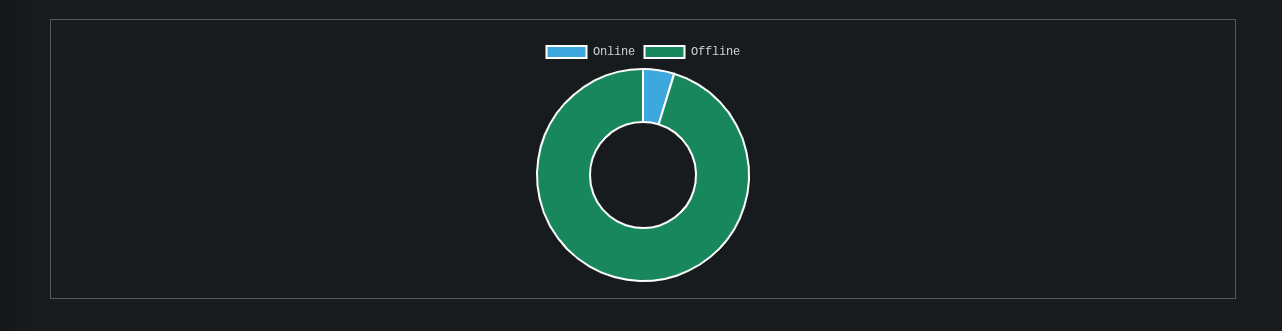
Permissions: sensor.list (read-only).
A few things the chart helper does for you:
- Colors itself from your theme. Leave datasets uncolored and they're assigned
the console palette automatically — pie and doughnut charts get one color per
slice. Toggle dark mode and the chart re-themes live. Pass an explicit
backgroundColorarray to choose specific colors (e.g. green for online, red for offline). - Supports the usual chart types —
bar,line,doughnut,pie, and more. Switch by changingtype. For a bar chart of activity over time, feedlabels(e.g. days) and adatasetsarray of counts. - No setup or downloads. The charting engine is provided by the runtime. Don't add your own chart library — external scripts are blocked.
Give the chart a height
A chart needs a container with a height or it renders invisible. Put the
<canvas> in a box with an explicit height (style="height:280px"), as above.
To chart a trend over time (detections per day, events per hour), feed the chart from a historical Search — see the next recipe.
Recipe: query historical events with Search
To look at historical telemetry and detections, use the Search service (the
same engine as the Query Console). It's a two-step call: start a query, then read
the result. Add { service: 'search' } to route to it.
Ask the assistant:
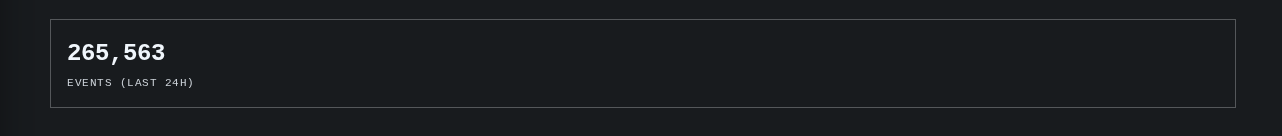
"Count the events across all sensors in the last 24 hours and show it as a big number."
<div class="lc-card"><div class="lc-kpi">
  <span class="lc-kpi__value" id="count"><span class="lc-spinner"></span></span>
  <span class="lc-kpi__label">Events (last 24h)</span>
</div></div>

<script>
  ;(async () => {
    const el = document.getElementById('count')
    try {
      await lc.ready
      const oid = lc.ctx.orgs[0].oid
      const end = Math.floor(Date.now() / 1000)
      const start = end - 24 * 60 * 60

      // The assistant writes and validates the LCQL for you. A counting query
      // ends with `COUNT(event) as count`. startTime/endTime are Unix seconds
      // passed as strings (they override any time range in the query).
      const init = await lc.api('POST', '/v1/search/',
        { oid, query: '* | * | / exists | COUNT(event) as count',
          startTime: String(start), endTime: String(end) },
        { service: 'search' })

      // A search runs asynchronously — the spinner stays up while we poll.
      let res = init
      while (!res.completed) {
        await new Promise((r) => setTimeout(r, res.nextPollInMs || 1000))
        res = await lc.api('GET', '/v1/search/' + init.queryId + '/',
          null, { service: 'search' })
      }

      // A COUNT query returns one aggregate row in the events block.
      const block = (res.results || []).find((b) => b.type === 'events')
      const count = block && block.rows && block.rows[0] ? block.rows[0].data.count : 0
      el.textContent = Number(count).toLocaleString()
    } catch (e) {
      el.innerHTML = '<span class="lc-badge lc-badge--danger">Error: ' + e.code + '</span>'
    }
  })()
</script>
Requires: the search service declared on the app, plus the insight.evt.get
permission — the assistant sets both up. A COUNT(...) projection returns the exact
total in a single aggregate row, no matter how many events match.
Let the assistant write LCQL
LimaCharlie's query language (LCQL) has its own syntax that's validated against your organization's data. Don't hand-write it — describe what you want to count or find, and the assistant generates and validates the query. See LCQL Examples for what's possible.
Recipe: an embedded sensor panel
An app can appear on a sensor's page and automatically know which sensor you're
viewing. The console passes the sensor's ID into lc.ctx.context.sid.
Ask the assistant:
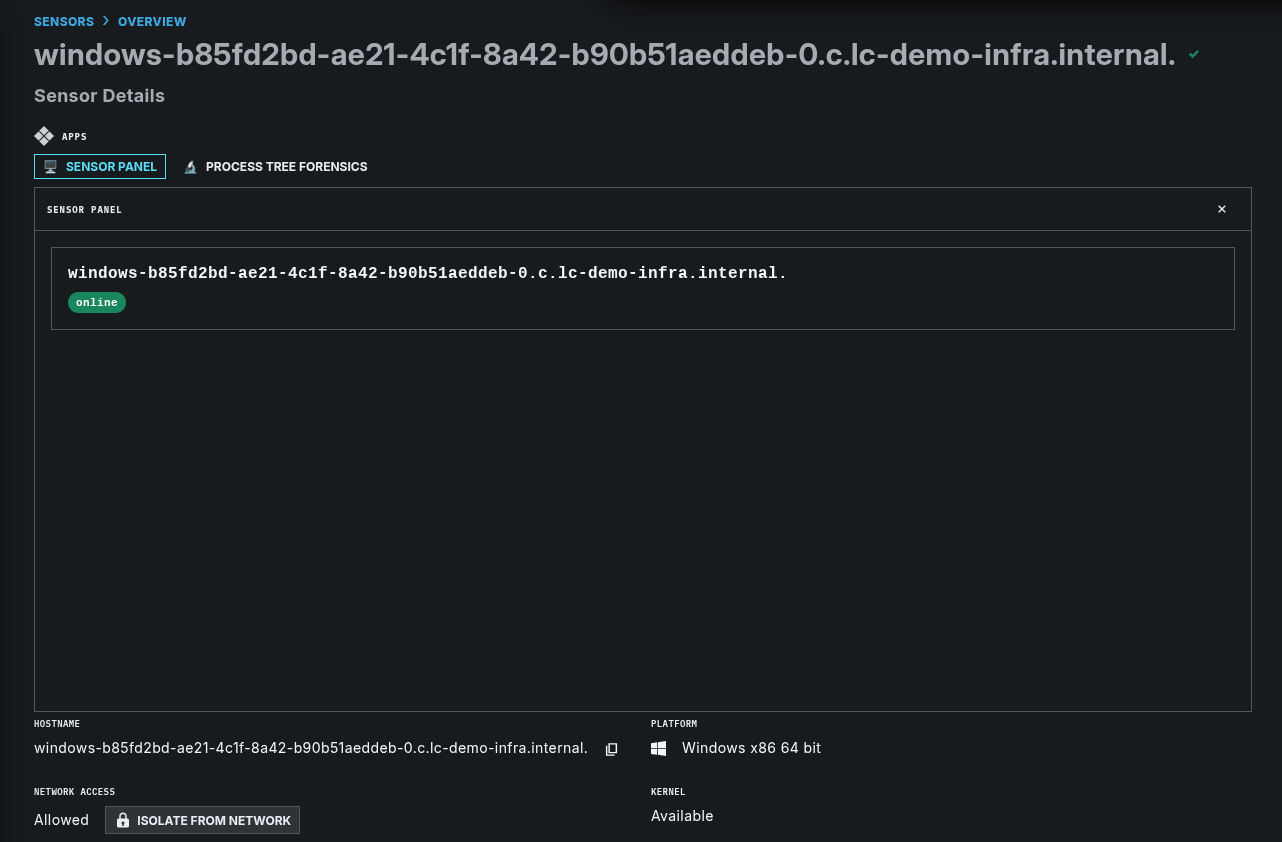
"A panel that shows up on each sensor's page with that sensor's hostname and online status."
<div class="lc-card" id="panel"><span class="lc-spinner"></span></div>

<script>
  ;(async () => {
    await lc.ready
    const sid = lc.ctx.context.sid          // provided by the host on a sensor page
    const panel = document.getElementById('panel')
    if (!sid) {
      panel.innerHTML =
        '<p class="lc-muted">This panel embeds on a sensor’s page, where it shows ' +
        'that sensor’s status. Open it from any sensor to see it in action.</p>'
      return
    }
    try {
      // GET /v1/<sid> returns { online: { is_online }, info: { hostname, … } }.
      const data = await lc.api('GET', '/v1/' + sid)
      const hostname = (data.info && data.info.hostname) || sid
      const online = !!(data.online && data.online.is_online)
      panel.innerHTML =
        '<h2>' + hostname + '</h2>' +
        '<span class="lc-badge ' + (online ? 'lc-badge--positive' : '') + '">' +
        (online ? 'online' : 'offline') + '</span>'
    } catch (e) {
      panel.textContent = 'Error: ' + e.code
    }
  })()
</script>
Permissions: sensor.get.
When you build this, tell the assistant you want it on sensor pages so it sets the
location to within a sensor and the expected context to sid. See
Choosing where an app appears.
Recipe: call an external service
An app can call an outside website — for example, to enrich an indicator with a third-party service — but only if that site is declared up front and shown to you on the consent screen. By default an app can reach nothing external.
Ask the assistant:
"Look up the reputation of an IP address using
and show the result."
<div class="lc-row">
  <input class="lc-input" id="ip" placeholder="8.8.8.8" />
  <button class="lc-btn lc-btn--primary" id="go">Look up</button>
</div>
<pre class="lc-card lc-mono" id="out" style="margin-top:8px">—</pre>

<script>
  document.getElementById('go').addEventListener('click', async () => {
    const ip = document.getElementById('ip').value.trim()
    const out = document.getElementById('out')
    out.textContent = 'Looking up…'
    try {
      // Only works because https://ipinfo.io is a declared allowed origin.
      // Swap in your own threat-intel provider — and declare its origin too.
      const r = await fetch('https://ipinfo.io/' + encodeURIComponent(ip) + '/json')
      out.textContent = JSON.stringify(await r.json(), null, 2)
    } catch (e) {
      out.textContent = 'Lookup failed (is the origin declared?): ' + e
    }
  })
</script>
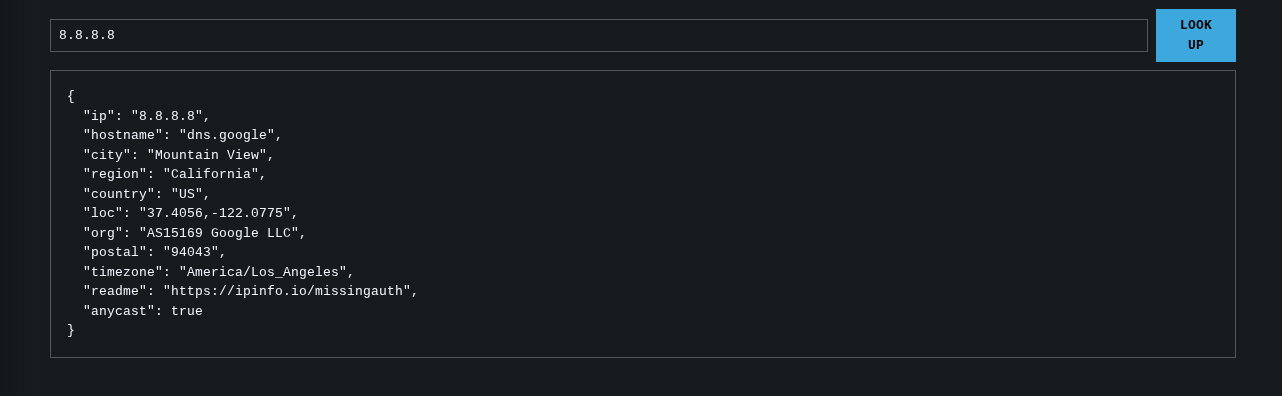
This runs as-is: it calls ipinfo.io, a free, CORS-enabled IP
lookup, so you only need to declare https://ipinfo.io as an allowed origin. Swap
in your own threat-intel provider the same way — declare its origin and adjust the
URL.
External access is a data-exfiltration surface — declare it carefully
Any LimaCharlie data your app can read could be sent to a declared external
site. That's why declaring one makes the consent screen warn every viewer.
Only add external origins you trust, and request the fewest read
permissions the app needs. Note external calls use your app's own fetch
(with no LimaCharlie key attached), not lc.api.
The external site must allow browser calls
The app's fetch is a cross-origin browser request, so the site must return
permissive CORS headers (Access-Control-Allow-Origin) — many APIs don't —
and it must be reachable from your network (security setups commonly block
DNS-over-HTTPS and other uncommon endpoints). A Failed to fetch with no
network request means the origin is undeclared, CORS-blocked, or
network-blocked.
Where to go next
- Reference — every design-system piece, the full
lc.apiandlc.chartcontracts, permissions, limits, and error codes. - Creating & Managing Apps — build, manage, and place your app.
- Config Hive: Apps — the record format and programmatic management.